Sampling Parameters: temp / top-k / top-p
Language models output raw, unnormalized scores known as logits, for every token in the vocabulary to be used in the next token prediction. Sampling parameters control the next token selected from these output logits. These parameters are also options in LLM API calls, and many people don't actually know what they mean. Here I dive deeper into temperature, top-k, and top-p sampling, and run experiments to visualize their impact on text generation.
Temperature
The most naive way to select the next token from the output logits is to just take the maximum value every time, known as greedy decoding. The problem with this is that there is no diversity in the outputs. Temperature scaling is a way to increase this variety of text generated, by dividing the logits by a parameter known as the temperature, which must be a number greater than zero. The softmax function is then run on the logits divided by the temperature.
Higher temperatures greater than 1 will provide more uniform token distributions, and temperatures less than 1 will result in more confident distributions favoring higher probability tokens. To understand this intuitively take the example of two logits with values 5.0 and 2.0, with a range of 3.0 between them. If we divide them by a higher temperature, 2.0 we get 2.5 and 1.0, reducing the distance between the two to 1.5. On the other hand, if we divide by a small temperature like 0.25, the logits become 20.0 and 8.0, increasing the distance to 12.0. Softmax amplifies larger gaps stretching the distance even more, really favoring the top token. It also spreads the tokens out more evenly for smaller gaps.
The choice of temperature depends on the task the language model is being used for. If you have tasks that require limited variation like data extraction and code, you want a lower temperature to reduce the variance of generated tokens. Tasks like writing or brainstorming will benefit from high temperature values, outputting more unlikely tokens and boosting creativity of the generated text. General guidance is that a balanced temperature is around 0.7, and you don't need to go any higher than 2.0.
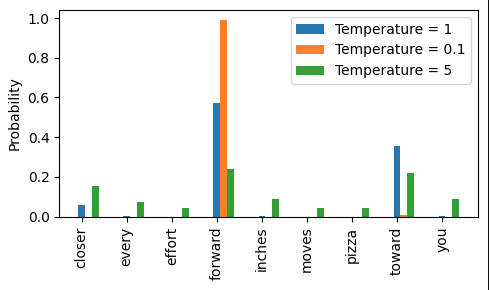
Effect of temperature on token probability distributions.
Top-k
Top-k sampling is used alongside temperature, restricting the sample tokens to the top-k most likely tokens (tokens with the highest probabilities). This is a good way to increase variation, but keep the text close to the relevancy of the current text sequence. The one problem with top-k sampling is that it is always a fixed number and cannot adapt to different scenarios. Certain token predictions may benefit from a higher or lower value of k, for example if k is high but there is only one valid next token for a sequence. Top-p sampling is a different approach that solves this problem.
Top-p (nucleus sampling)
Top-p, or nucleus sampling works similarly to top-k, but only keeps tokens until the cumulative probability reaches a threshold p. Token probabilities are added from largest to smallest until the value p is reached, and the rest are discarded.
Unlike top-k sampling, if the model is very confident in one token as the next token, top-p favors this token if it is near the threshold value, and it can adapt well to other situations like this.
Experiments
Understanding the concept of these sampling parameters was simple, but to gain a deeper understanding of them I implemented each separately and ran experiments to visualize their effects.
Temperature = 0
First, I ran text generation with a temperature of 0, which just skips the temperature calculation and runs a greedy decoding selection. The output was as expected, the text generated got stuck in a greedy decoding loop, constantly picking the most likely next token and repeating the same characters.
Starting text: "The future of AI is"
Text generated: "The future of AI is uncertain. The future of AI is uncertain.

The future of AI is uncertain. The future of AI is uncertain.

The future of AI is uncertain. The future of AI is uncertain.

The future of AI is uncertain."
Entropy vs Output Diversity
Next, I wanted to visualize the relationship between entropy and output diversity. Entropy measures randomness of the logits and directly correlates to temperature. A higher entropy results in a variety of possible next tokens, and a lower entropy increases the confidence of the next predicted token. Output diversity measures how diverse the tokens in the generated text are. I plotted a graph of entropy vs diversity for different p values in top-p sampling, and saw that an increase in entropy directly correlated with an increase in output diversity. This was as expected but the graph makes it a little easier to comprehend.

Entropy vs output diversity for different top-p values.
Interactive Visualizer
Lastly, I created an interactive visualizer in the Jupyter notebook with ipywidgets where you can tune the k, p, and temperature values and see the difference in generated text. This was the most helpful in visualizing the relationship each parameter has on text generation.
Interactive visualizer: tune temperature, top-k, and top-p to see their effect on generated text.
References
- "Build a Large Language Model (From Scratch)" by Sebastian Raschka
- https://www.geeksforgeeks.org/artificial-intelligence/graph-based-semi-supervised-learning/
- https://machinelearningplus.com/gen-ai/llm-temperature-top-p-top-k-explained/